GRAPHS!
1.the value which is varying is always on the y-axis while the constant value is on the x-axis.
2.no unbroken lines
3.it must be neat and thin
4.the points can be joined using a ruler or by hand
5.do not draw beyond the plotted points.
6.blobs or centre points more than 1mm are NOT acceptable
7.if zero is present in the reading, ur graph MUST pass through zero.
8.label both axis!
9.use appropriate units
10.use appropriate scale
11.use sharpened pencil to plot
12.plot the dots within circles, of equal sizes, must be clear and not too big.
SOURCES OF ERRORS!
1.temp nt controlled
2.pH not controlled or nt measured accurately
3.difficulty in judging the colour.
4.difficulty in having the same time
5.inaccuracy in preparing serial dilution
6.inaccuracy of equipment, fr e.g. pipette/syringe
7.too short time.
8.evaporation of the solution which can cause the concentration to change.
LIMITATIONS OF ERRORS!
1.measure the volume accurately using syringe with narrow range of calibration
2.repeat more times at each pH/conc./temp
3.use range of pH/conc./temp
4.accurate specific measuring devices
5.use colorimeter to measure the degree of colourness.
6.use buffer to control pHs
7.use of water bath/thermostat to control temp
8.use thermometer to measure the temp.
9.thermostatically controlled environment.
10.repeat with each conc.
11.volume of the sample(e.g. enzyme/substrate) must be the same..cuz as volume increases, conc also increases
12.keep only one factor different, and all others must be the same.
Reliability.....take minimum of 3 readings!
repeat with mre pH/conc/temp
and find out their mean
Accuracy.....seing electronic thermostat
use of pippettes instead of measuring cylinders
KEY
1)read the whole question till the end
2)decide number of readings to take
3)don't go for more or less than 3 readings per conc/vol of any ques.
4)make a table
5)write down the UNITS in each coloumn of the table...e.g. conc/cm^3 , temp/°C
MICROSCOPY!!!
1)propotion of thickness must be correct.
2)draw the organelles where u see them, dont just draw anywhere within the cell! never draw what u know.
3)whenever u see the plant cells, draw the cell walls.
4)IN PLAN DIAGRAMS, NO DRAWING OF ANY CELLS, AND NO SHADING...if u'll do either of them, u'll lose the whole mark!!
5)when asked to draw 2 cells, draw the ones that are easiest to draw. and dont draw more then 2 cells!
6)fraw the adjacent (touching) cells.
7)drawing should be large, unshaded.
8)in plan diagrams show the relative thickness of each layer.
9)draw the exact shape, if its oval or round or has wavy outlines
10)label the diagram...simplest thing to label is cytopasm, nucleus and cell membrane.
11)if its a trachea cell, then label goblet cells, cilia, blood vessels, muscular tissue, cartilage cells (lacunae)
12) when asked to compare 2 diagrams....make a table (drawing a table itself has 1 mark!)....put atleast one similarity
ERRORS IN MESUREMENTS!
1)irregular in shape
2)difficulty in focusing
3)preperation is squashed
and yeahhhh one more thingg, the values must be whole numbers!!! e.g if its 8.5mm u round it off to a whole number which is 9!!
Simple dilution and Serial dilution??
Serial dilution is actually very easy. If you have 30cm3 of 10% enzyme solution (example) you take 20cm3 of that 10% in put it in beaker 1. From this 20cm3 in beaker 1, take another 10cm3 and place it in beaker 2 and add 10cm3 of water. This dilutes the solution into 5%. Do the same thing for beaker 3, take 10cm3 of the 5% solution and add 10cm3 of water in beaker 3 to get 2.5% solution.
This way you have:
Beaker 1 - 10% enzyme solution
Beaker 2 - 5% enzyme solution
Beaker 3 - 2.5% enzyme solution
Usually you get a specimen on a slide or a photomicrograph to draw a plan diagram.
For a low power drawing
1. you must not draw individual cells when drawing a plane diagram.
2. draw only the outline of tissues.(don’t shade, draw thinner continuous lines.)
3. When drawing a specimen on a slide you can use high power to clearly see where the edges of
tissues.
4. Your drawing should cover more than the half of the space given.
When labelling(if you are asked to do so….)
1. label using a pencill and make sure the end of the line exactly touches the structure.
2. write the labels horizontally and outside the drawing itself.
3. Don't cross over the lines when labelling.

[PA] use an eyepiece graticule and stage micrometer scale to measure cells and be familiar with units (millimeter, micrometer, nanometer) used in cell studies; Calibration with a standard stage micrometer with pitch [0.1 mm]

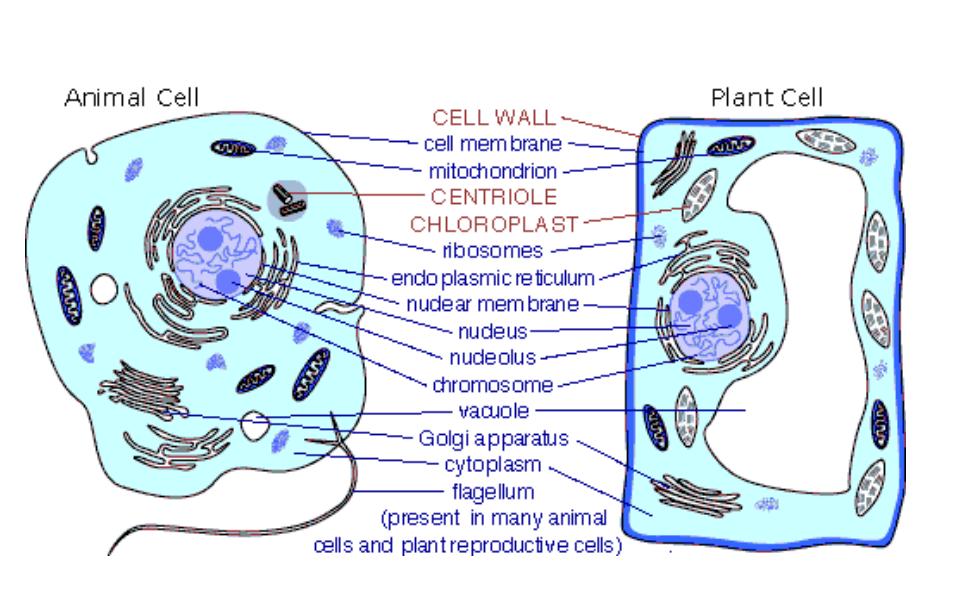
(2) [PA] compare and contrast the structure of typical animal and plant cells;


Characteristics and roles;
Root and Stem:
▪ Epidermis: surface of the stem made of a number of
layers often with a waxy cuticle to reduce water
loss.
Cortex Tissue:
Forming a cylinder of tissue around
the outer edge of the stem. Often contains cells with
secondary thickening in the cell walls which
provides additional support.
Vascular bundle:
contains xylem, phloem and
cambium tissue.
▪ Xylem: a longitudinal set of tubes that conduct
water and mineral salts from the roots upward
Spongy mesophyll:
contains spaces that allows the
movement of gases and water through the leaf
tissue..
Lower epidermis:
bottom surface layer of tissues
which contains the guard cells that form each
stoma
(4) [PA] calculate linear magnification of drawings and
photographs;
m = (I/O) [I measured with a 30 cm rule and O with a
calibrated eyepiece graticule]
(5) [PA] calculate the actual sizes of specimens from
drawings and photographs


No comments:
Post a Comment